We count whatthe market repeats
Scan millions of ticks + financial data every second — identify repeating patterns and their track record
Detect. Confirm. Act.
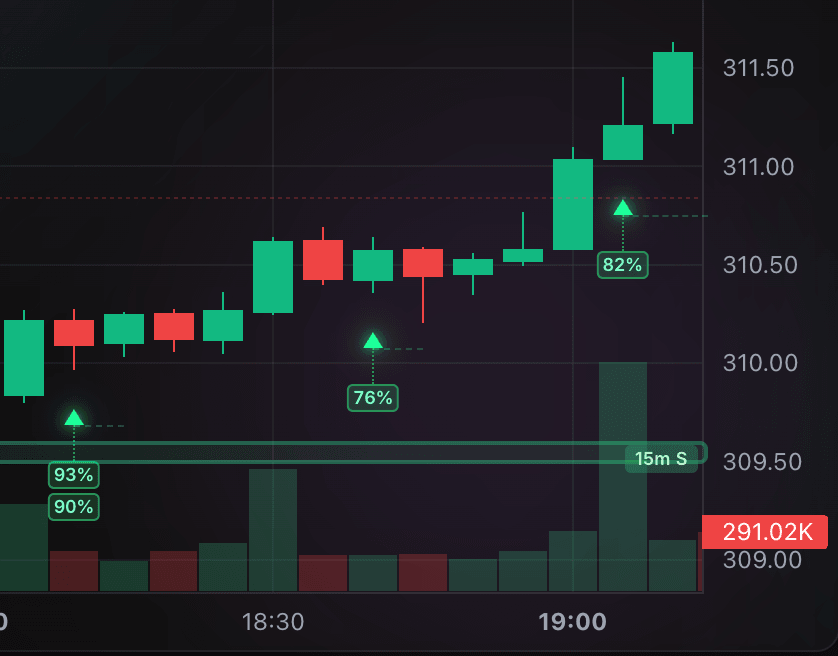
Find the trigger
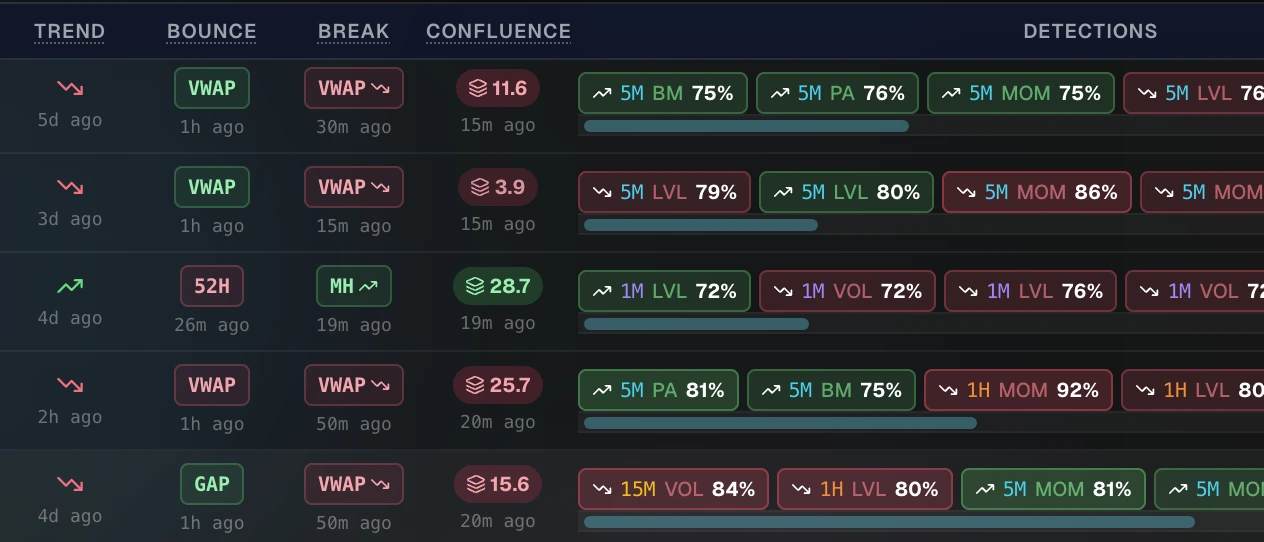
Bounces, breaks, and trend shifts — spotting the moment they occur in real-time. Scanner tracks hundreds of key levels like VWAP, prior highs/lows, gaps, DMA's etc. across multiple timeframes, detecting them in microseconds.
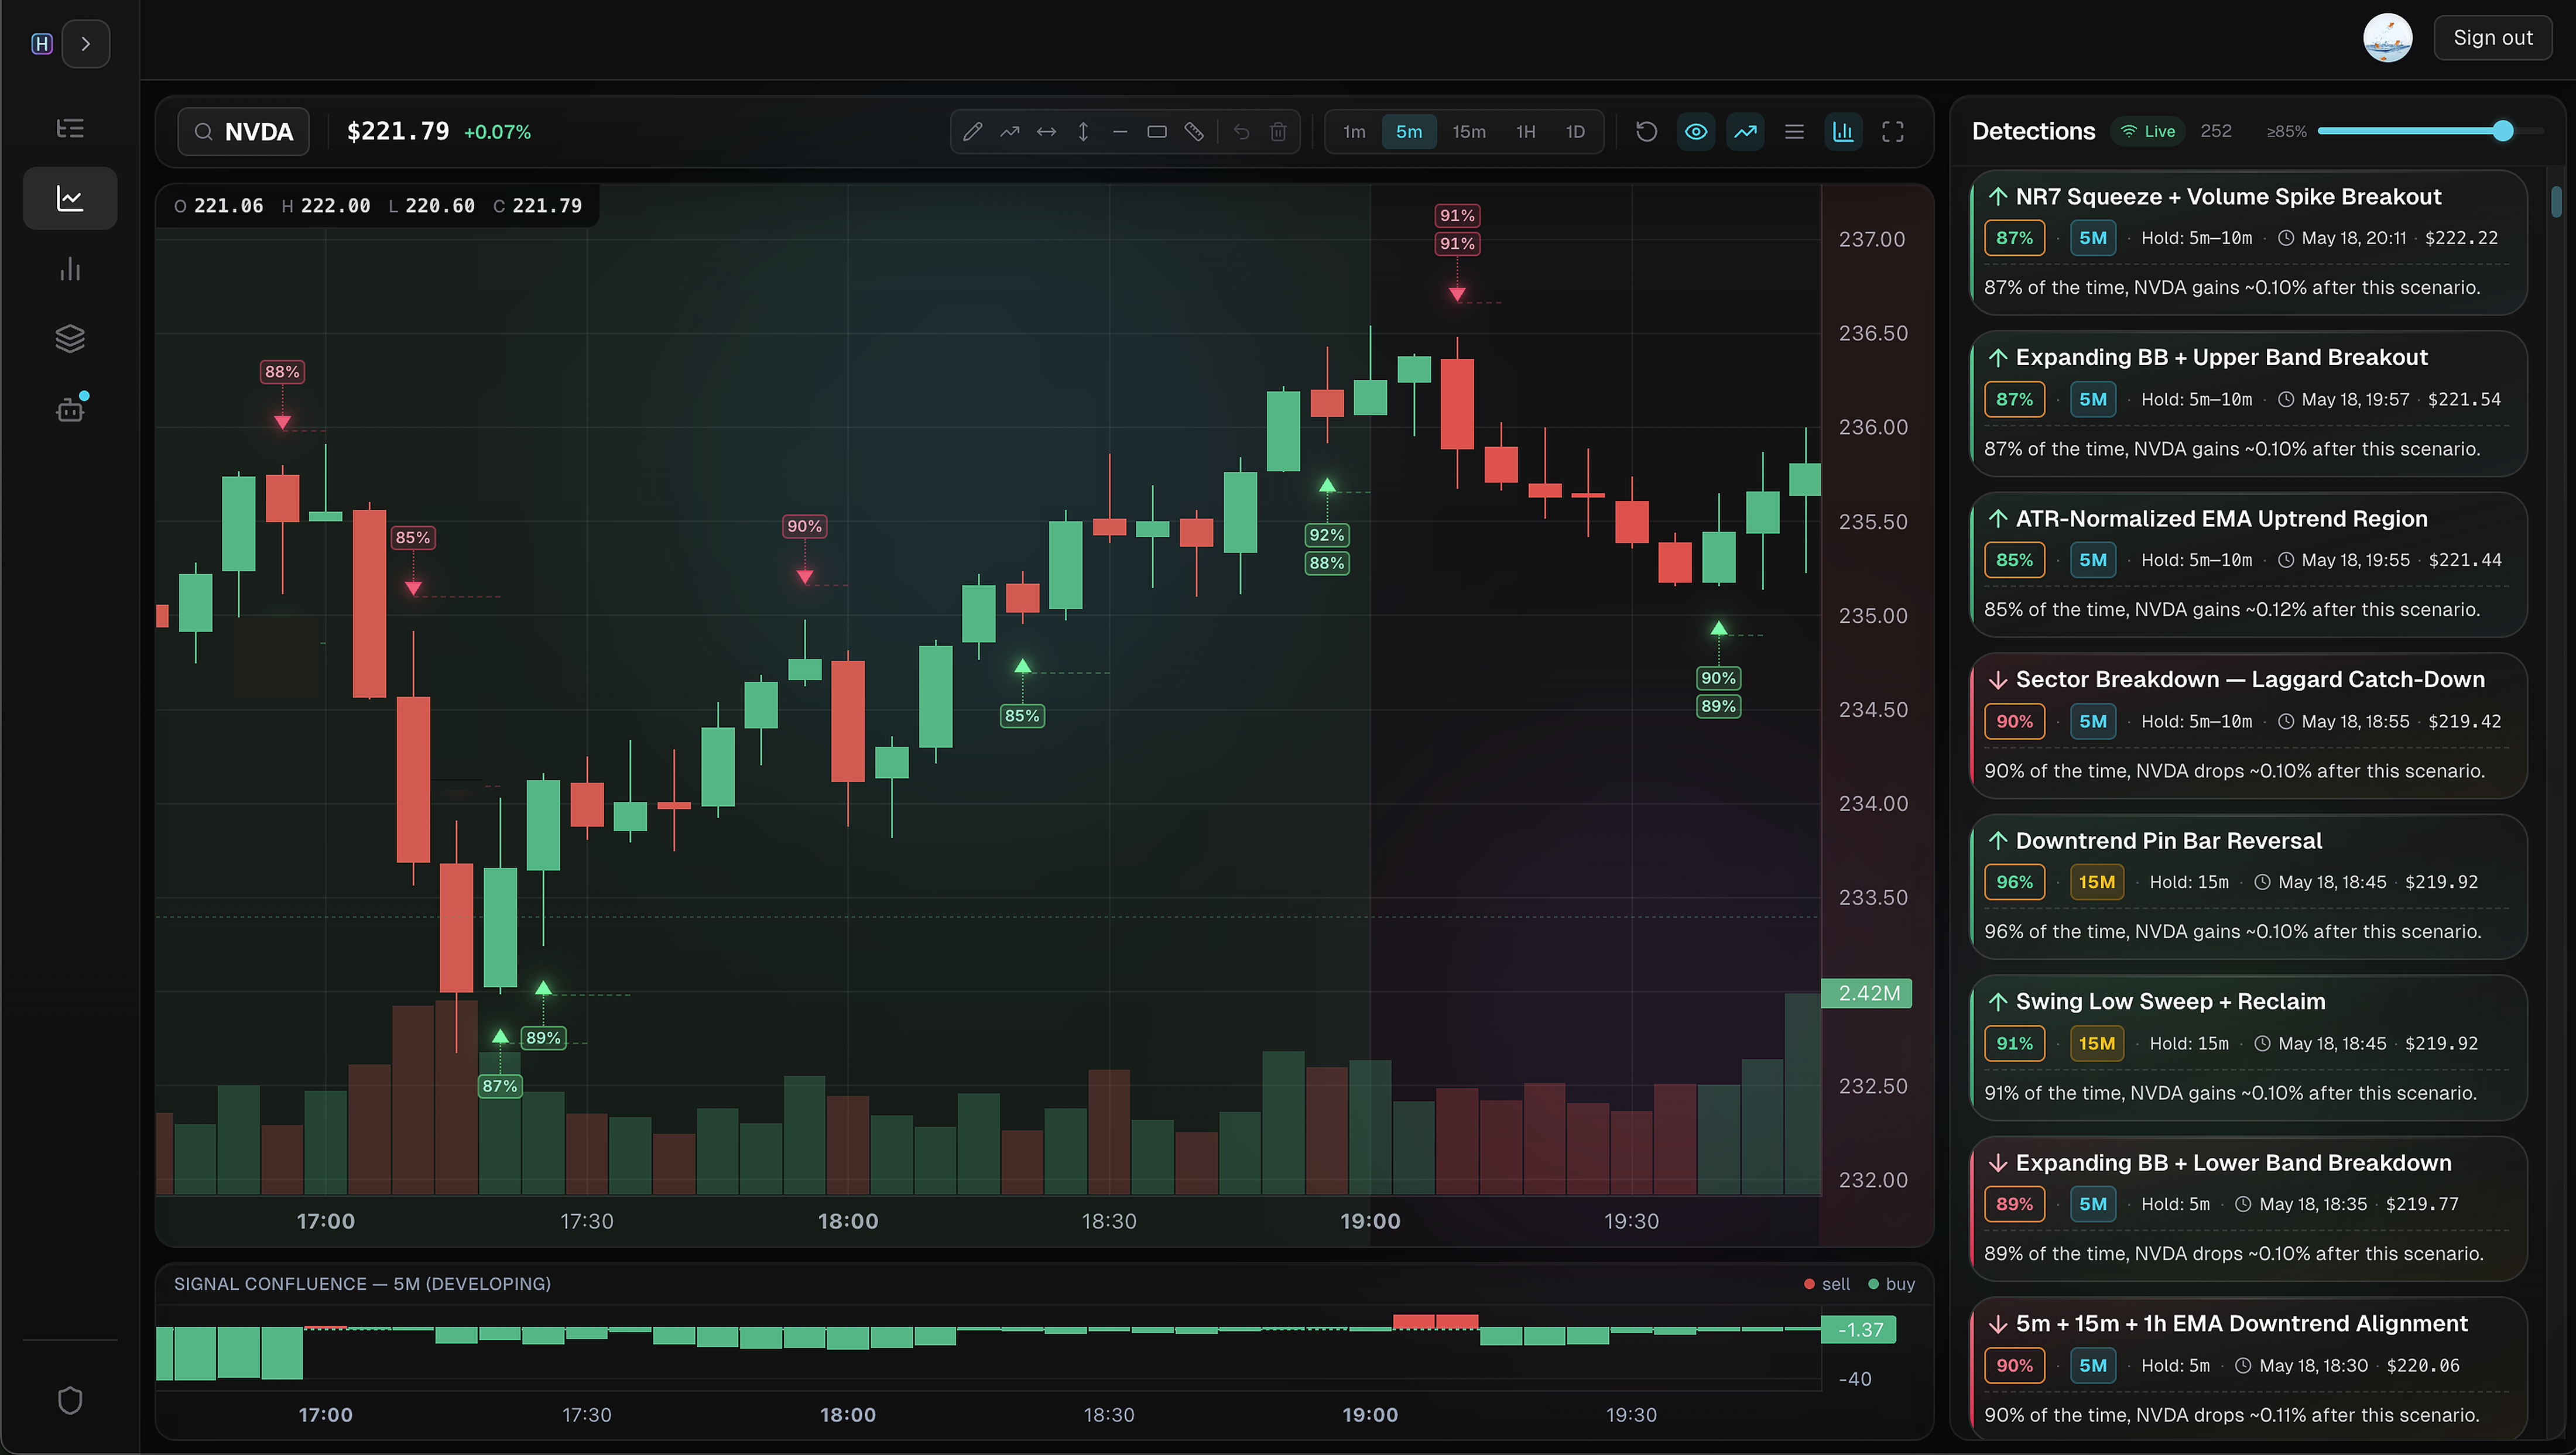
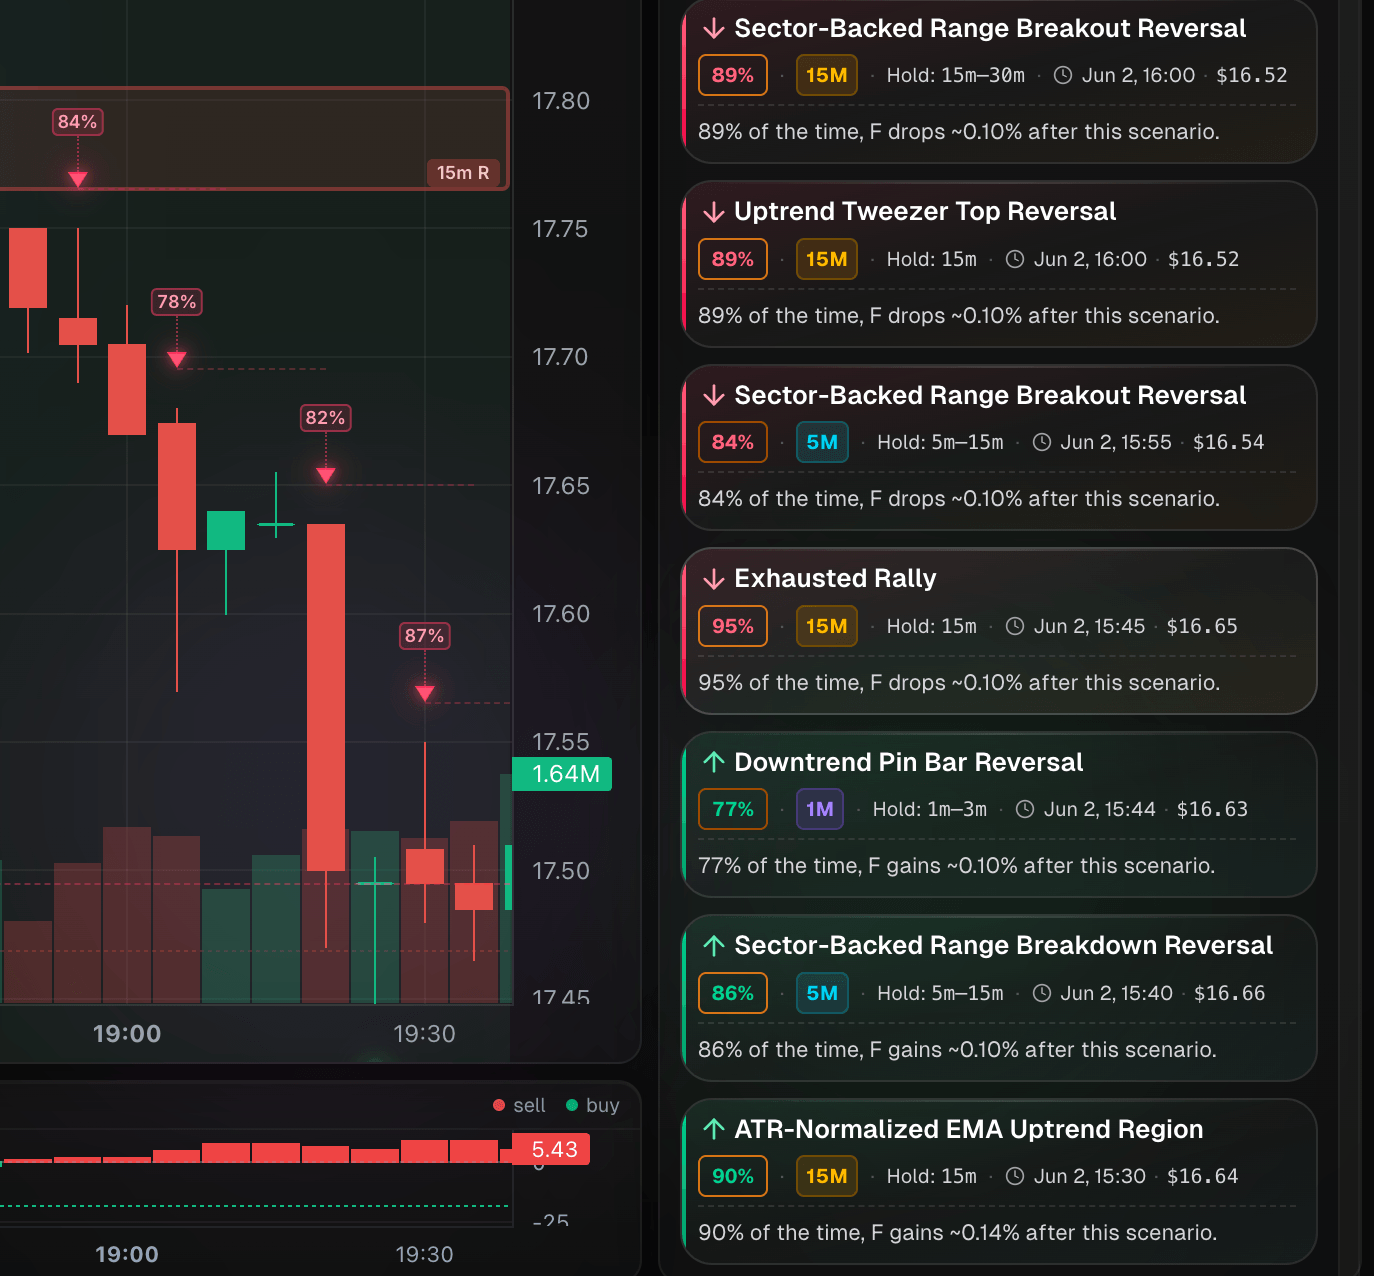
Score the setup
The moment a pre-built scenario is detected, HyProbe labels it right on the chart with a regime-adjusted success rate. For example, when a Liquidity Absorption scenario fires on AAPL's 15-minute chart in a bullish regime, HyProbe shows that 8 of its last 10 occurrences were followed by AAPL rising at least 0.5% — an 80% success rate. Hundreds of scenarios like this are scanned in real time across multiple instruments and timeframes.
Time the reversal
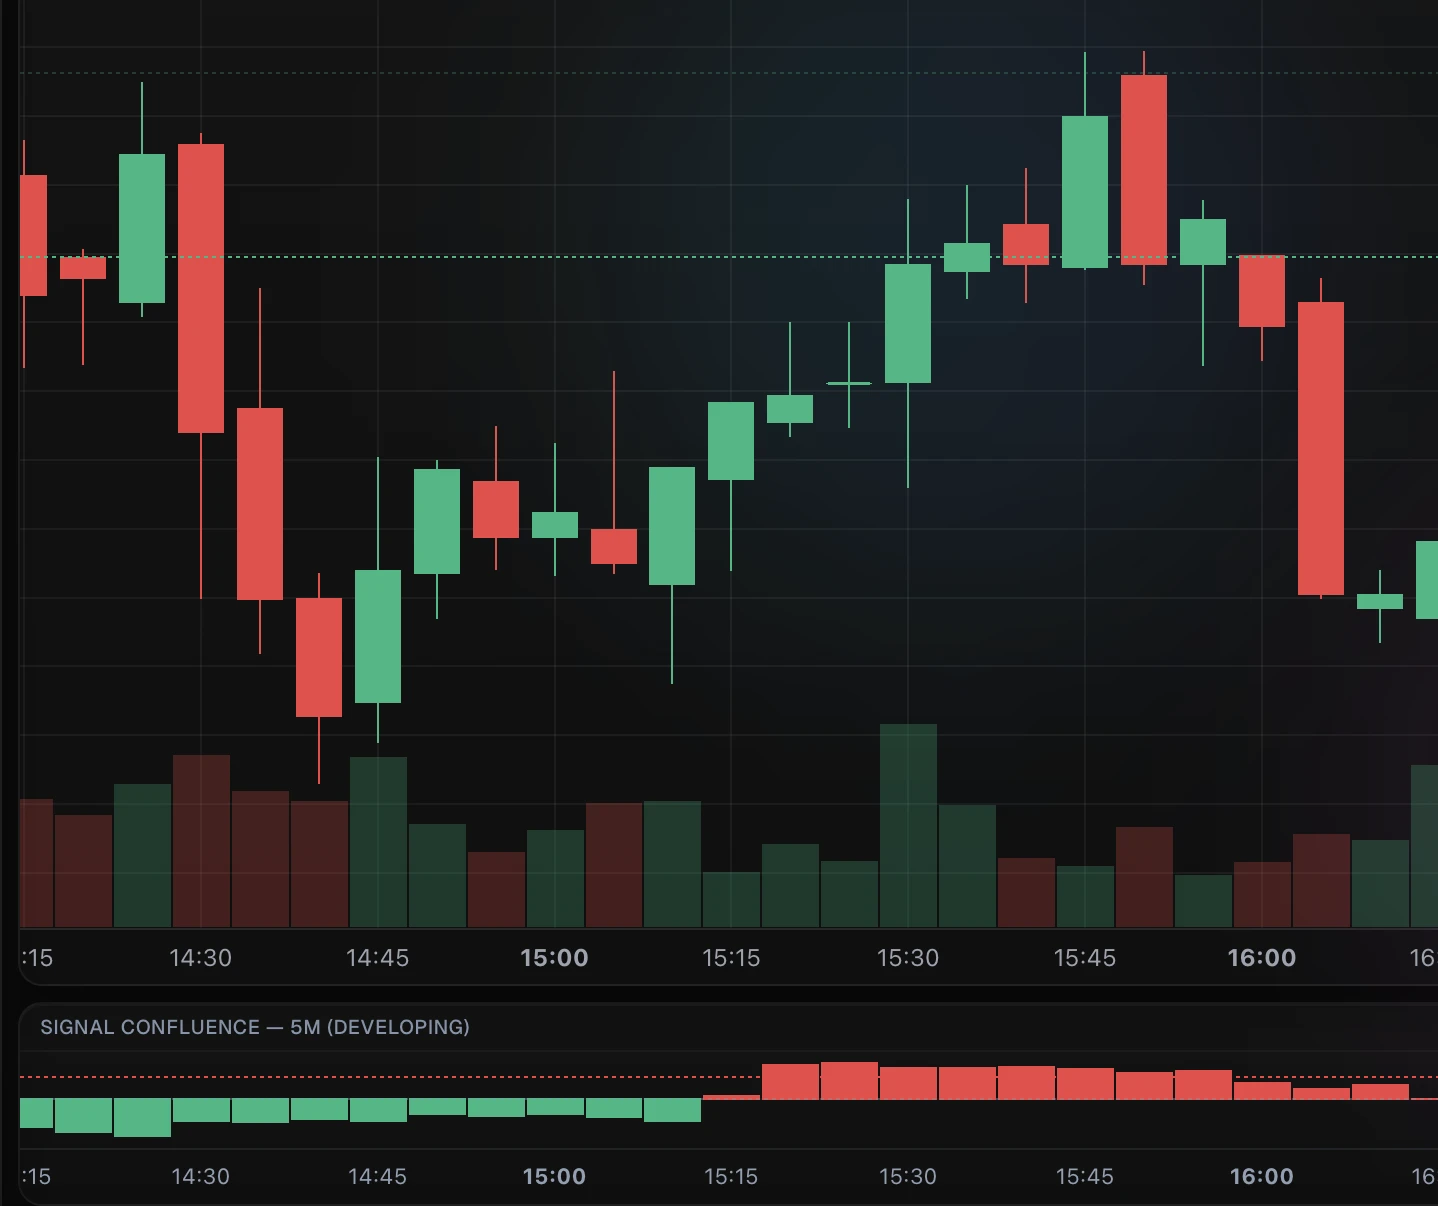
Every detection probability across every timeframe rolls into one number — the confluence score. The confluence score is the fair value in realtime, and because it leads price, it tends to peak before the reversal occurs.
Everything you need to trade and invest with conviction
Ultra fast detections
Patterns detected across hundreds of instruments and multiple timeframes in under a second — the moment it happens, it's on your screen.
Multi-timeframe charts
Support/resistance zones, key levels, trends, bounces and breaks from multiple timeframes — everything you need in one single view.
Scenario library
Hundreds of scenarios - price action, levels, volatility, liquidity, broad market etc. A scenario is a repeatable patterns modeled using advanced statistics.
Regime-adjusted probabilities
Each scenario's success rate is computed per regime (not a static historical average) — so the probability in a bull market differs from a bear or a range market.
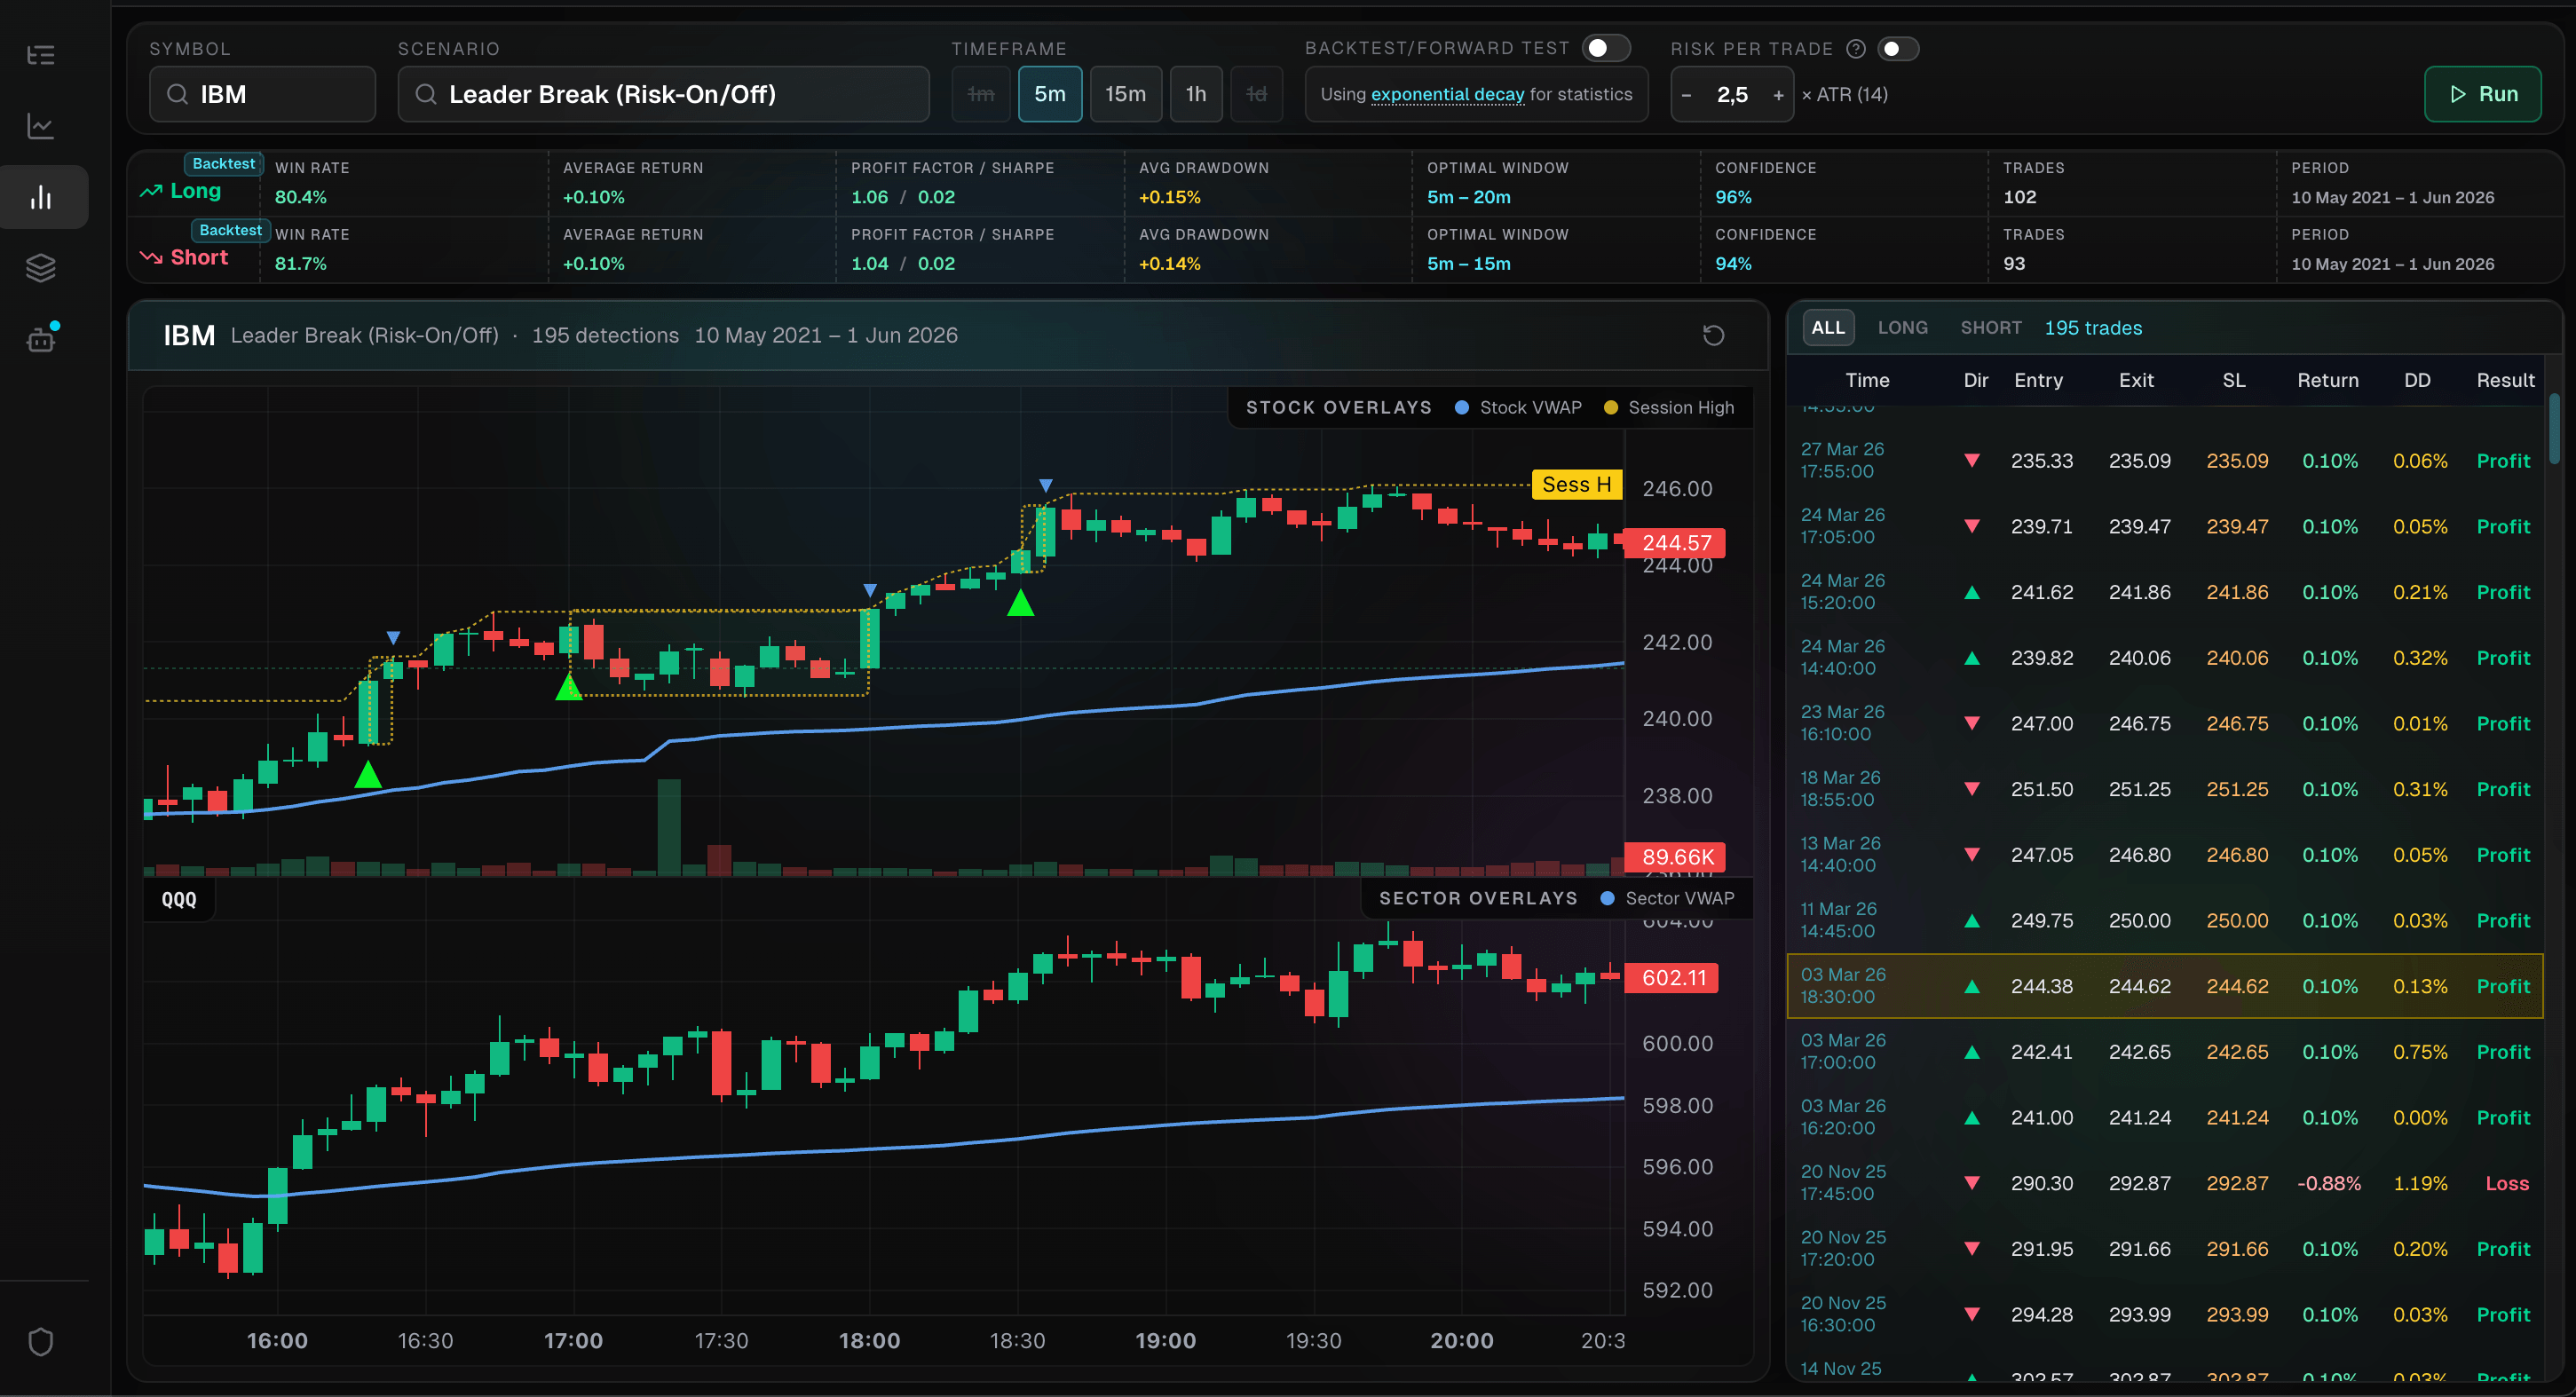
Backtest and forward test
Every scenario in our library can be backtested and forward-tested against years of data — observe how it performed in different market conditions.
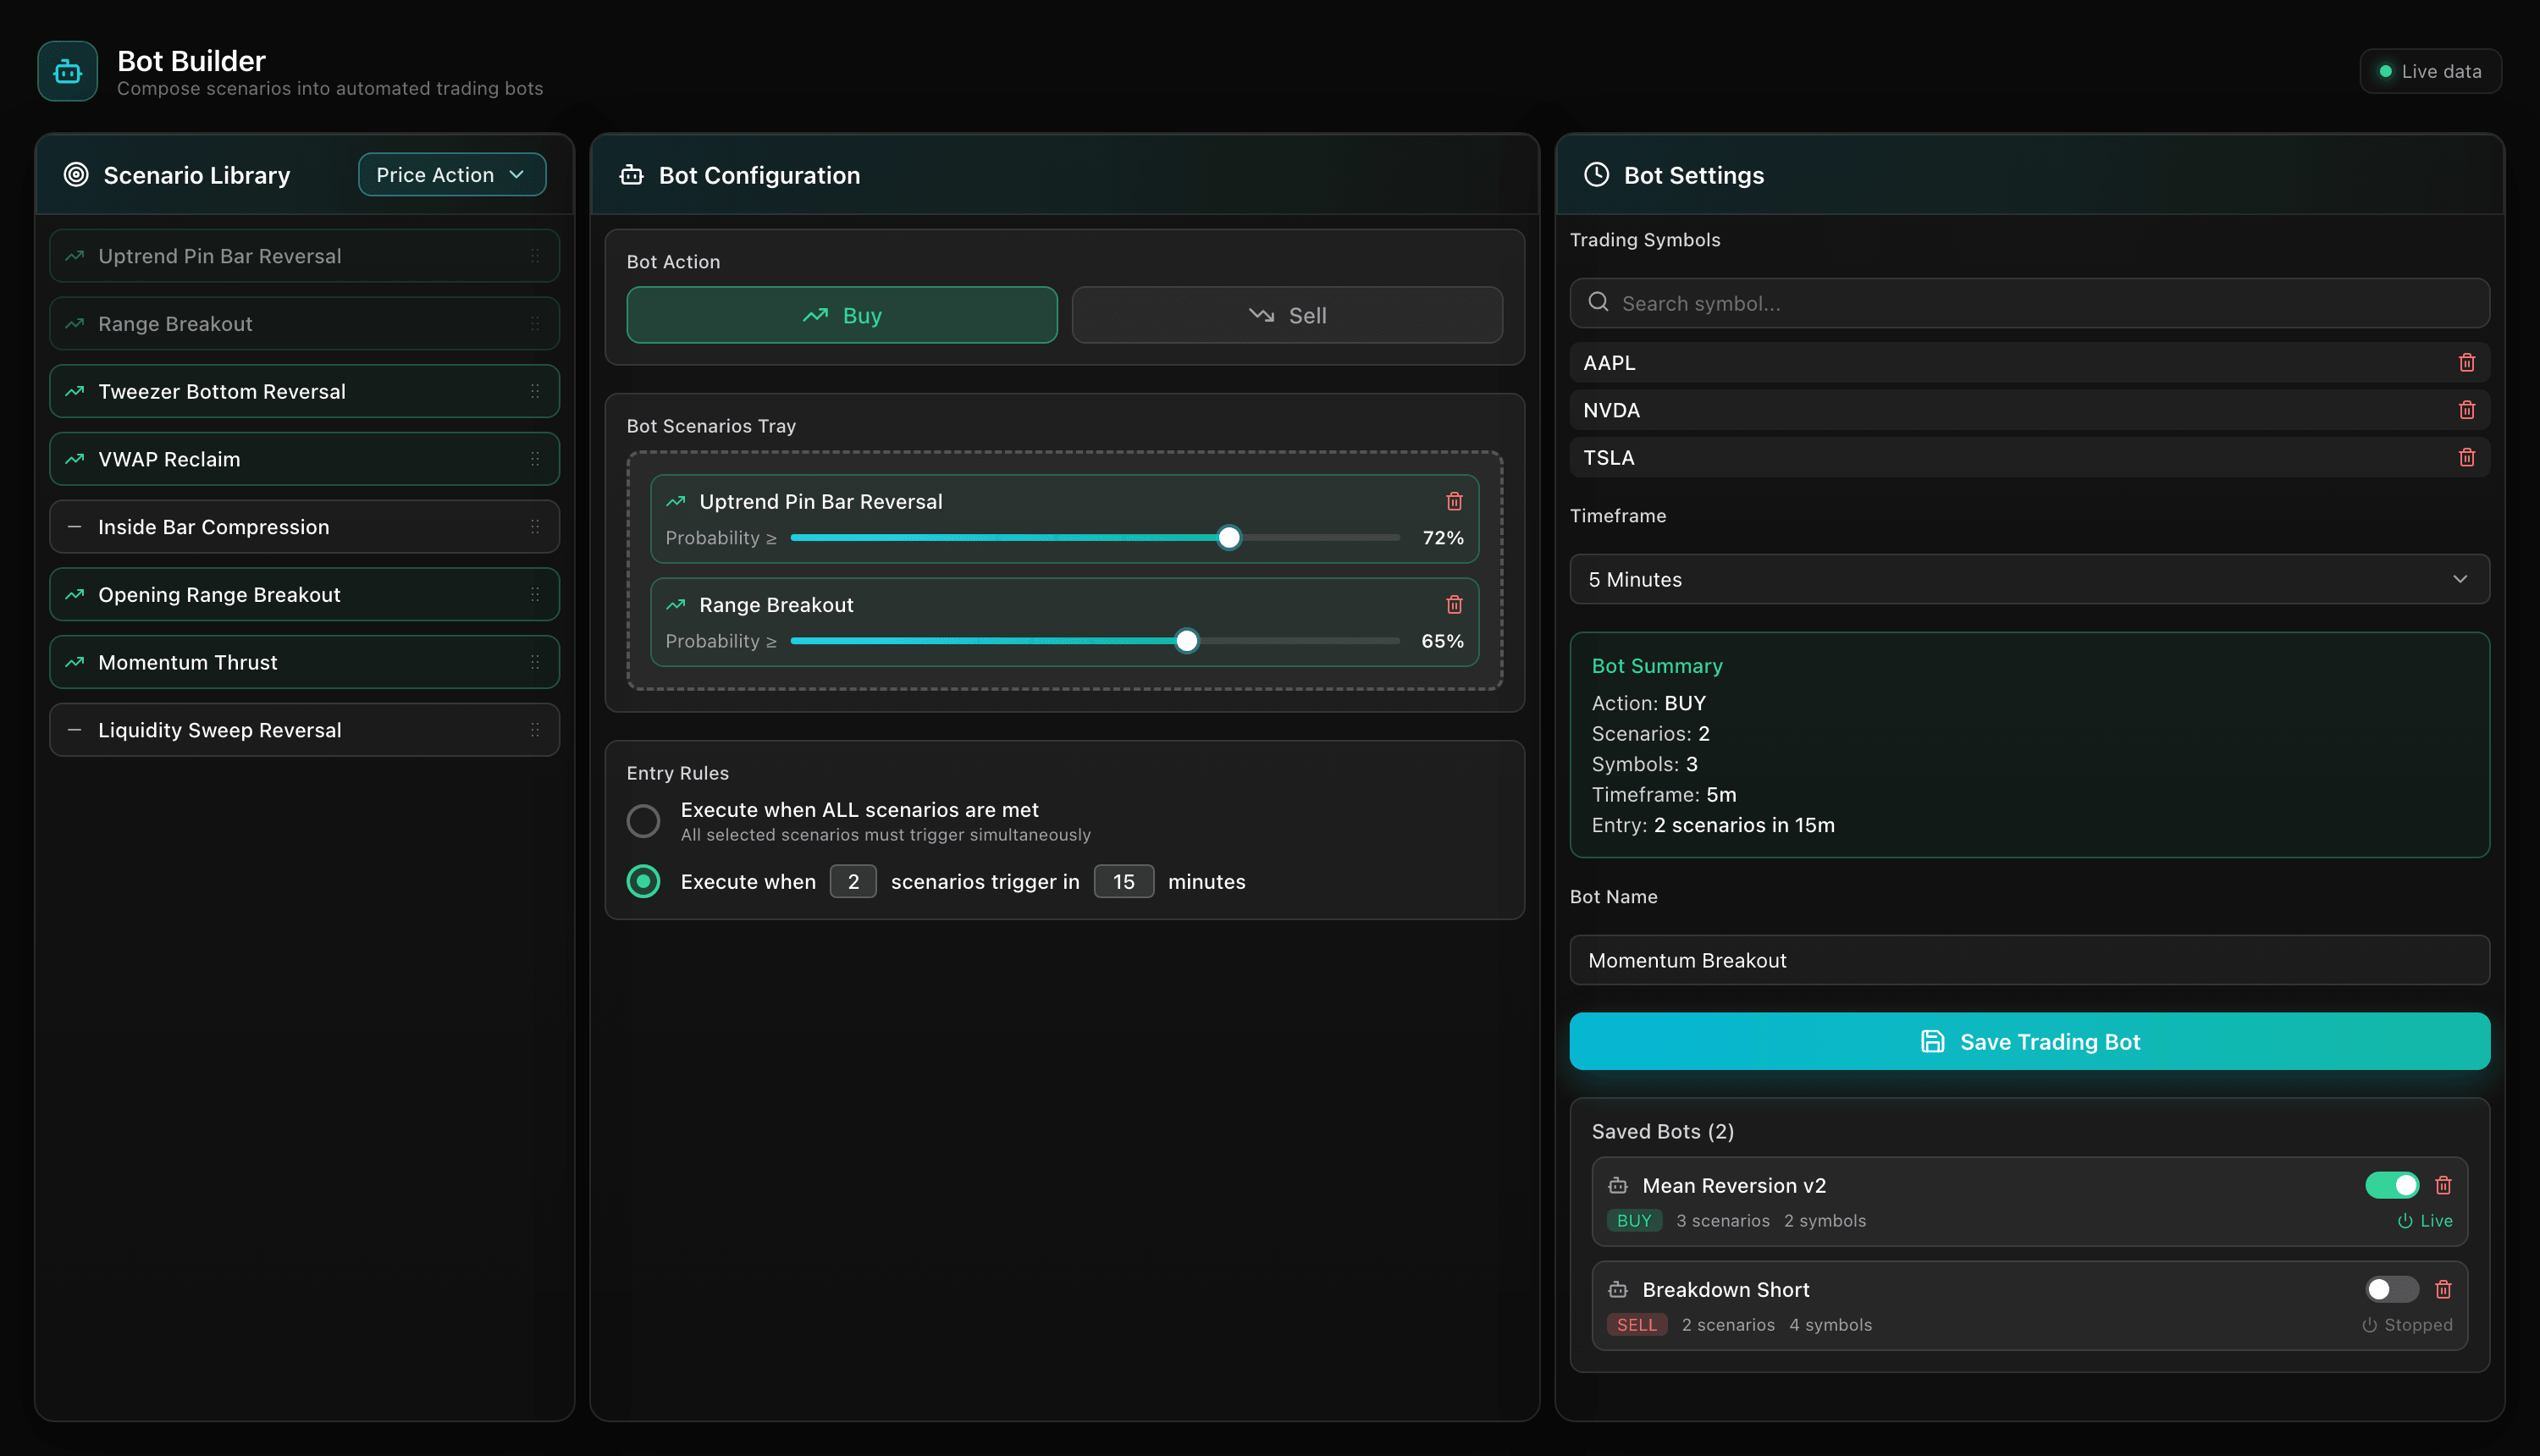
Trading automation
Turn HyProbe scenarios and detections into automated rules you define and control — from detection to execution through your broker.
Starter
Get started with delayed data.
- 100+ US Stocks
- 100+ pre-built scenarios
- Detection scanner — 15 min delayed
- Unlimited charts — 15 min delayed
- Confluence analysis — 15 min delayed
- Full backtesting
Pro
Real-time data, full toolkit.
- 100+ US Stocks & US Futures
- 100+ pre-built scenarios
- Detection scanner — Realtime
- Unlimited charts — Realtime
- Confluence analysis — Realtime
- Full backtesting
- Detection feed API — WebSocket & REST
- Dedicated support
Questions & Answers
HyProbe doesn't rely on traditional indicators. We scan millions of market ticks and other financial datasets every second to detect high-probability patterns modeled as scenarios — each with a regime-adjusted win rate, not a static historical average. Scenarios get detected realtime and probabilities update in real time across multiple timeframes, and every scenario can be backtested and forward-tested against years of market data before you trade it live.